8月1日雅思 Task 1 真题解析:两个图表可以分开写,但千万别“各写各的”
- 2026-09-23 03:06:19
8月1日雅思考试结束后,这道 Task 1 混合图表题引起了不少讨论。
题目要求考生分析:
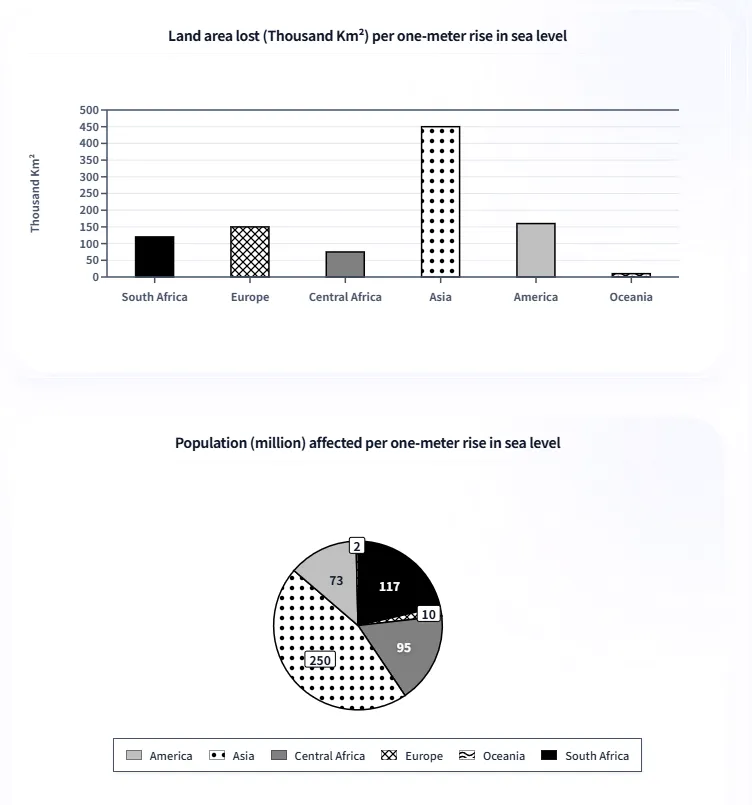
海平面上升1米后,不同地区损失的土地面积; 同样情况下,各地区受到影响的人口数量。
乍一看,这道题并不复杂。一个柱状图,一个饼图,数据也不算特别多。
不少考生考完后的想法是:“柱状图写一段,饼图写一段,应该没问题吧?”
事实上,这也是我在批改 Task 1 时经常看到的问题。很多同学不是不会写,而是把两个图表处理成了两个完全独立的信息块:第一个图告诉我什么,我翻译出来;第二个图告诉我什么,我继续翻译出来。
数据基本都写到了,但文章读起来更像是在“整理图表”,而不是在“分析图表”。而这,往往就是很多作文停留在 6 分左右、难以上 7 分的原因。
IELTS WRITING TASK 1 REAL QUESTION NO. 434
"The charts below show the projected loss of land area (thousand km²) and population (million) affected per one-meter rise in sea level in the predicted future."
Summarise the information by selecting and reporting the main features, and make comparisons where relevant.
这道题为什么容易写成 6 分?
先说明一点:两个图表分两个主体段写,并没有错。 很多高分 Task 1 也会采用:Body 1 描述第一个图;Body 2 描述第二个图。
真正的问题不是“分开写”,问题是:两个主体段之间没有任何联系。
BAND 6.0 PITFALL | 典型断层流水账写法
Asia loses 450 thousand km² of land.
America loses 160 thousand km².
Europe loses 150 thousand km².
然后下一段:
Asia affects 250 million people.
Central Africa affects 95 million people.
诊断分析: 每一句都正确。但是考官读完之后会发现:你告诉了他很多数字,却没有告诉他这些数字意味着什么。
Band 7 的关键:比较,而不是罗列
雅思 Task 1 Band 7 对 Task Achievement 的要求之一是:presents a clear overview and compares key features appropriately. 这里有两个关键词:
1. Overview
你需要总结主要趋势。比如:亚洲在两个指标中都是影响最大的地区。这属于基本要求。
2. Compare key features
更重要的是比较数据之间的关系。这道题真正值得写的不是:“亚洲是多少,中非是多少。”而是:土地损失面积和人口影响是否呈现一致趋势?答案是:并不完全一致。
看懂这道题的三个关键点
① 亚洲:最明显的共同趋势
土地损失:450 thousand km²受影响人口:250 million两个指标均远高于其他地区。因此 Overview 中应该首先指出:Asia would be by far the most severely affected region in both categories.(这是考官希望看到的主要特征)
② 中非:最值得展开的反差
只看柱状图,Central Africa 土地损失 75 thousand km² 并不突出;但看第二张图,受影响人口高达 95 million(排名第二)。高分作文关注的不是单个数字,而是:这个数字和其他数字放在一起说明什么。Despite experiencing relatively limited land loss, Central Africa faces a disproportionately large population impact.(说明土地损失和人口影响之间存在明显差异)
③ 欧洲:与中非形成对比
欧洲刚好相反:土地损失 150 thousand km²(排名靠前),但是受影响人口只有 10 million(非常低)。Europe presents the opposite pattern, with a relatively large area of land loss but a comparatively small affected population.(把中非和欧洲放在一起比较,文章的分析深度就出来了)
如果只是描述两个图,会少掉什么?
我们来看两个版本:
普通版本:
"Asia loses the largest amount of land. Central Africa affects 95 million people."
信息正确,但是两个句子之间没有关系。
高分版本:
"Although Central Africa suffers a relatively small loss of land, it has the second-largest affected population, showing that land loss does not necessarily correspond to human impact."
区别在哪里?不是词汇更难,而是作者做了一步:解释数据之间的关系。 这一步,正是很多 6 分作文缺少的。
8分范文:如何把两个图表联系起来?
BAND 8.0 | FULL MODEL ESSAY
The bar chart and pie chart illustrate the projected loss of land area (in thousand km²) and the population affected (in millions) following a one-metre rise in sea level across six regions.
Overall, Asia would be by far the most severely affected region in both categories, recording the greatest land loss and the largest affected population. However, the rankings of the two indicators do not completely correspond, with Central Africa showing a relatively high population impact despite limited land loss, while Europe demonstrates the opposite pattern.
Regarding land loss, Asia is expected to experience the greatest decline, at 450 thousand km², which is considerably higher than all other regions. America and Europe follow with similar figures of 160 and 150 thousand km² respectively. South Africa and Central Africa would lose smaller areas of land, at 120 and 75 thousand km², while Oceania would experience only a negligible loss of 10 thousand km².
The distribution of affected population presents a somewhat different picture. Asia again ranks first, with 250 million people impacted. Central Africa, despite losing only 75 thousand km² of land, has the second-largest affected population, at 95 million. South Africa also experiences a substantial human impact, with 117 million people affected. In contrast, Europe, although recording a relatively high land loss of 150 thousand km², affects only 10 million people.
这篇范文值得学习什么?
很多同学看到 8 分范文,第一反应是:“我要背这些高级词。” 其实更值得学习的是它的分析方式。
普通表达:
"Central Africa has 95 million affected people."
高分表达:
"Central Africa, despite losing only 75 thousand km² of land, has the second-largest affected population."
后者的优势:多做了一件事——把两个图的数据连接起来。
写在最后:
混合图表题真正难的地方,不是数据多,而是你有没有意识到,几个图表其实是在共同描述一个问题。所以以后遇到类似 Task 1,不要急着想“第一个图写什么,第二个图写什么”,先问自己:“这些数据之间有什么联系?”因为小作文 7 分的分水岭,往往不是语言,而是你有没有真正读懂图表。
LumiWrite 提醒:Task 1 高分不是靠套模板。先提取图表中的关键关系,再组织语言表达,才能稳定提升。

